In this post I will share a little trick that could make calculating annual returns (or any kind of periodic returns) more convenient in Microsoft Excel.
Suppose you’re tasked to calculate annual returns from the following monthly stock price data using Excel:
| Date | Price |
|---|---|
| Dec-20 | 1,152 |
| Jan-21 | 1,147 |
| Feb-21 | 1,138 |
| Mar-21 | 1,138 |
| Apr-21 | 1,142 |
| May-21 | 1,139 |
| Jun-21 | 1,137 |
| Jul-21 | 1,122 |
| Aug-21 | 1,135 |
| Sep-21 | 1,134 |
| Oct-21 | 1,134 |
| Nov-21 | 1,135 |
| Dec-21 | 1,128 |
| Jan-22 | 1,119 |
| Feb-22 | 1,118 |
| Mar-22 | 1,117 |
| Apr-22 | 1,095 |
| May-22 | 1,108 |
| Jun-22 | 1,106 |
| Jul-22 | 1,107 |
| Aug-22 | 1,099 |
| Sep-22 | 1,096 |
| Oct-22 | 1,095 |
| Nov-22 | 1,098 |
| Dec-22 | 1,100 |
Calculating manually, we can see that the return for year 2021 is 1128/1152-1 = -2.12%, while the return for year 2022 is 1100/1128-1 = -2.48%.
Obviously, we don’t want to calculate it manually (or using hard-coded reference), since the data might change from time to time.
In the past, I’d usually use INDEX & MATCH to retrieve the prices at the start and end of the period, or use some kind of =PRODUCT(1+IF(...)-1) formula.
Recently, I found that this problem can be answered more conveniently if we exploit the relationship between simple return $R_t = P_t/P_{t-1}-1$ and log-return $r_t = \ln(1 + R_t)$. The return (or simple return) for the full period is simply:
\[\begin{align*} R &= (1 + R_1)(1+R_2)(...)(1+R_T)-1 \\ &= \prod_{t=1}^T (1+R_t) - 1 \end{align*}\]If we move the $-1$ to the left-hand side and take the logarithm on both sides we’ll get:
\[\begin{align*} \ln(1 + R) &= \ln\left(\prod_{t=1}^T 1 + R_t\right)\\ &= \sum_{t=1}^T \ln\left(1 + R_t \right)\\ &= \sum_{t=1}^T \ln r_t \end{align*}\]In other words, we can get the full period log return by calculating the sum of each period’s (e.g. monthly) log return. To take the full period’s simple return from this calculation, we can simply take the exponent like so:
\[\begin{align*} 1 + R &= \exp(\ln(1+R))\\ R &= \exp(\ln(1+R)) - 1 \end{align*}\]Going back to our original problem, we will start by adding two new columns: “Year” (which will indicate what year each row belongs to) and “Log Return”:
| Date | Price | Year | Log Return |
|---|---|---|---|
| Dec-20 | 1,152 | 2020 | |
| Jan-21 | 1,147 | 2021 | -0.41% |
| Feb-21 | 1,138 | 2021 | -0.85% |
| Mar-21 | 1,138 | 2021 | 0.06% |
| Apr-21 | 1,142 | 2021 | 0.32% |
| … | … | … | … |
In Excel, the “Year” column is calculated with =YEAR(<date column>) formula, while the “Log Return” column is calculated with =LN(price2/price1) formula.
The calculation of annual return will be explained now. First, we will create the following table to contain the results:
| Year | Annual Log Return | Annual Return |
|---|---|---|
| 2021 | ||
| 2022 |
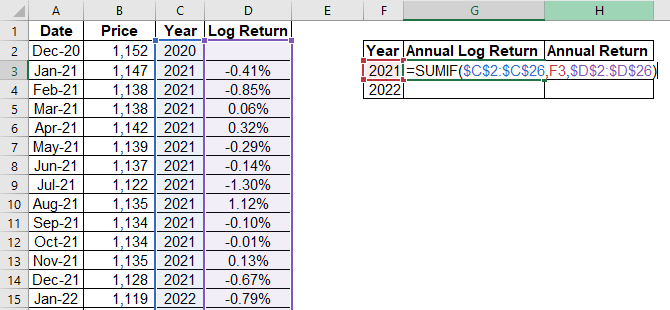
The “Annual Log Return” is calculated with the SUMIF formula: =SUMIF(<year column>,<year reference>,<log return column). Here’s the screenshot:
Finally, we can get the annual return using the EXP formula: =EXP(<annual log return>) - 1. Here’s the screenshot:
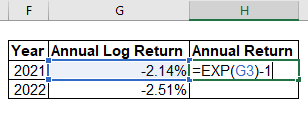
You will find the annual returns to be the same as we have calculated in the beginning.
Another benefit of using log return this way is for calculating annualized returns. Suppose that the data for 2021 was incomplete, that you only get the data starting from July 2021. However, you want to calculate the annualized return for 2021. For example, if the return from the end of July 2021 until the end of December 2021 was $0.47\%$, then the annualized return is $(1+0.47\%)^{12/5} - 1 = 1.14\%$. The way you do this with log return is by calculating the average of the log returns, and multiplying the result by 12 (since there are 12 months in a year). In Excel, you can achieve the result with the AVERAGEIF formula:
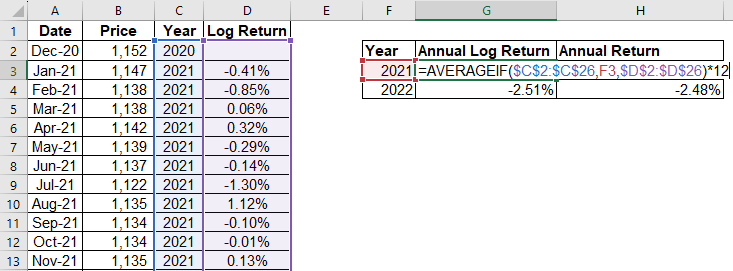
In this case, you will find the result to be the same as before, since we have complete monthly data for the year 2021.
Note that you can also do this for daily data, in which case you will multiply the average log return by 240 days (or whatever the convention is for annualizing daily data in your country).
That’s it for this post, hope it could be useful for you!