Background
This project is part of my submission for an SQL course that I’m taking for Pacmann Data Science Training.
Project Objectives
The objective of this project is to design a database system for an e-library application. The application has several libraries, and each library has a diverse collection of books. In the application, the users can borrow or place hold on books (if the book is currently not available for borrowing).
PostgreSQL is used to create the database, while Python is used to fill in the database with dummy data (to make sure that the database design is going to work well).
Designing the Database
Mission Statement
The library database system must be able to do the following:
- Store data of the library’s books collection
- Store data of the library’s lending activities and queues
- Determine how much of each book is available for lending
Satisfying the above requirements will help day-to-day operation of the application (e.g. books organization, book lending management, etc.) as well as for analysis (e.g. analyzing which books are popular lately).
Table Structure and Business Rules
The list of tables, its purpose, the fields of each table, and the constraints of each field are given below:
libraries: to store each library’s informationlibrary_id(PK), not nulllibrary_name: varchar, not null, unique
categories: to store each category’s informationcategory_id(PK), not nullcategory_name: varchar, not null, unique
books: to store books owned by the librarybook_id(PK), not nulltitle: varchar, not nullauthor: varchar, not nullcategory_id: integer, not null, references tablecategorieslibrary_id: integer, not null, references tablelibrariestotal_quantity: integer, not null, value >= 0
users: to store data of the app’s usersuser_id(PK), not nullemail: varchar, not null, uniqueuser_name: varchar, not null
queues: to store data pertaining to book lending queuesqueue_id(PK), not nullqueue_start: timestamp, not null, defaultnow()queue_end: timestamp, nulluser_id: integer, not null, references tableusersbook_id: integer, not null, references tablebooks
loans: to store data pertaining to book lending activitiesloan_id(PK), not nullbook_id: integer, not null, references tablebooksuser_id: integer, not null, references tableusersqueue_id: integer, not null, references tablequeuesloan_start: timestamp, not null, defaultnow()loan_due: timestamp, not null, calculated asloan_start+ 14 daysloan_end: timestamp, null, value >=loan_startand value <=loan_due
(Note: PK = primary key.)
Additional information:
- Each book is an e-book and has no physical form. Borrowed book is due after 14 days, and will be automatically returned if the user did not return before that time.
- Each book’s available quantity to be loaned can be inferred by subtracting
the number of outstanding books (i.e. books that are currently being loaned
to the users) from the total quantity of the book owned by the library. The
number of outstanding books are queried from the
loanstable, based on the rows where the fieldloan_endis null. - User can only borrow up to two books at a time, and can only queue two books at a time. The database would not enforce the requirements that the user can only hold/borrow up to two books at a time. Instead, it would be enforced by the application back-end.
Table Relationships
The relationship between each table is given as follows:
librariestobooks: 1-to-manycategoriestobooks: 1-to-manybookstoloans: 1-to-manybookstoqueues: 1-to-manyuserstoloans: 1-to-manyuserstoqueues: 1-to-manyloanstoqueues: 1-to-1
Implementing the Design
ERD Design
Based on the table specifications described previously, the entity relationship diagram (ERD) is as follows:
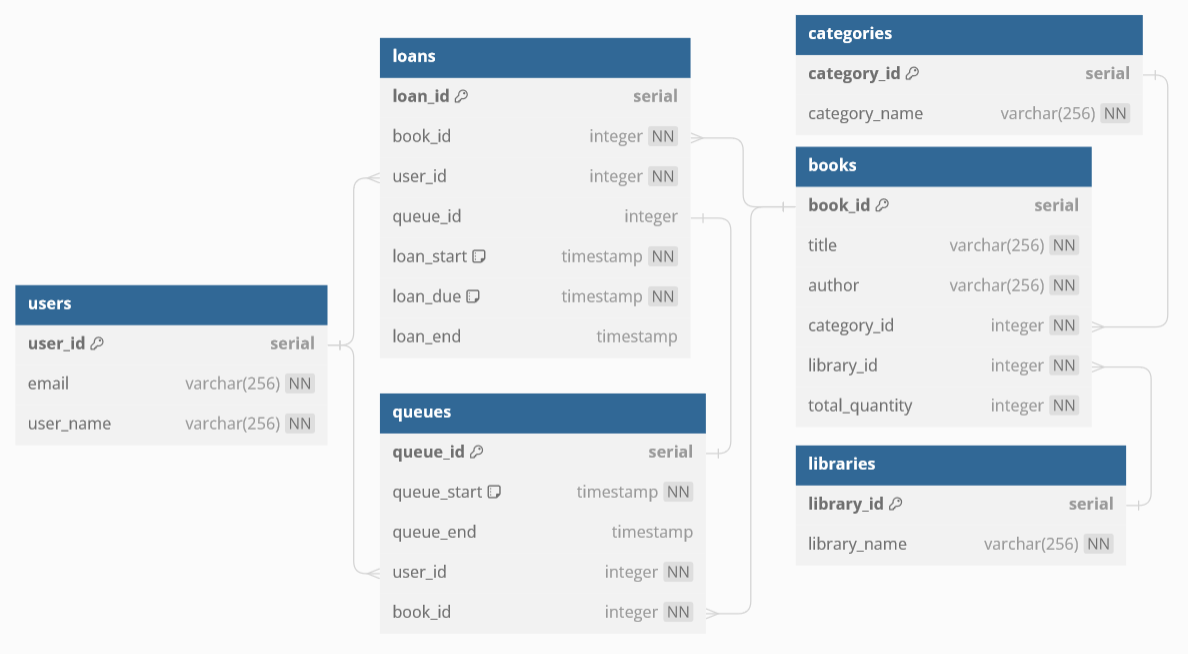
(Diagram created with https://dbdiagram.io/.)
Creating the Tables in PostgreSQL
All tables in the database are created with the following query (using PostgreSQL syntax):
create table libraries (
    library_id serial primary key,
    library_name varchar(256) not null unique
);

create table categories (
    category_id serial primary key,
    category_name varchar(256) not null unique
);

create table books (
    book_id serial primary key,
    title varchar(256) not null,
    author varchar(256) not null,
    category_id integer not null references categories,
    library_id integer not null references libraries,
    total_quantity integer not null,
    constraint total_quantity_nonnegative check (total_quantity >= 0)
);

create table users (
    user_id serial primary key,
    email varchar(256) not null unique,
    user_name varchar(256) not null
);

create table queues (
    queue_id serial primary key,
    queue_start timestamp not null default now(),
    queue_end timestamp null,
    user_id integer not null references users,
    book_id integer not null references books
);

create table loans (
    loan_id serial primary key,
    book_id integer not null references books,
    user_id integer not null references users,
    queue_id integer null references queues,
    loan_start timestamp not null default now(),
    loan_due timestamp not null generated always as
        (loan_start + interval '14 days') stored,
    loan_end timestamp null,
    constraint due_date_after_loan_date check (loan_due > loan_start),
    constraint return_date_between_two_dates check (loan_end >= loan_start and loan_end <= loan_due)
);
Populating the Database
Generating Dummy Data
There are three kinds of data to be generated for this database:
- Book details data
- User details data
- Lending/queueing activities data
For book details, I used the Amazon Kindle Books Dataset 2023 (I only used 300 most-reviewed books from the dataset). Meanwhile, for user details I used the Faker python library to generate dummy data.
Generating the lending activities data is not such a straightforward task, since there are restrictions like “number of borrowed books cannot exceed the book’s total quantity at any given time,” or “users cannot borrow more than two books at the same time,” and so on. If the data are just randomly generated, then those restrictions would certainly be violated. Therefore, I found the best method to generate the lending activities data is to simulate the library application.
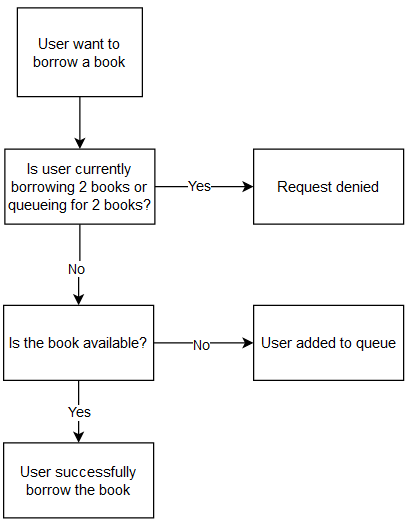
The simulation is done via a Python script, which will simulate the flow of events that will happen if the application were to actually be implemented. For example, in case of a user requesting to borrow a book, the following events will be executed:
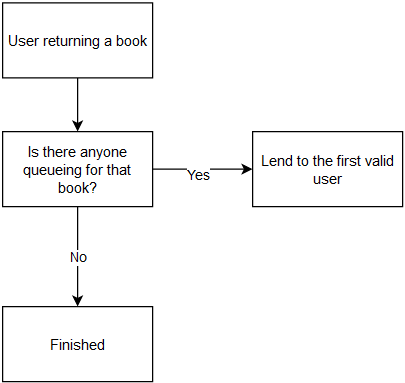
Meanwhile, the following events will be executed in case of user returning the borrowed book:
When running the simulation, the following parameters are specified so the results are reproducible:
- Number of books
- Number of users
- Expected total number of days
- Minimum and maximum borrow duration (the actual borrow duration for each lending is randomly generated using a uniform distribution)
- Minimum and maximum book total quantity (the actual total quantity for each book is randomly generated using a uniform distribution)
- Average arrival interval between each user (the actual arrival interval is randomly generated following a Poisson process, which is based on the M/M/1 queue model)
- Random number seed
The script for generating the data is too long to be included on this post, but it can be seen on the scripts generate_data.py and run_simulation.py on https://github.com/abangfarhan/simple-library-database.
Inputting the Dummy Data
There are two methods for inputting the dummy data: (1) saving the dummy data to csv files then import from pgAdmin, or (2) save the data directly from Python. I chose option number 2, since it would allow the project to be rebuilt more seamlessly (I can recreate the whole tables from a single script, instead of having to go back and forth between Python and pgAdmin). Here is an excerpt from the Python script that would save all of the tables into the database:
from sqlalchemy import create_engine
import pandas as pd

# ...

engine = create_engine(database_url)
dfs = (
    (df_categories, 'category', 'categories'),
    (df_libraries, 'library', 'libraries'),
    (df_books, 'book', 'books'),
    (df_users, 'user', 'users'),
    (df_queues, 'queue', 'queues'),
    (df_loans, 'loan', 'loans'),
)
for df,id_prefix,table_name in dfs:
    df = df.reset_index(drop=True)
    df[f'{id_prefix}_id'] = df.index
    cols = df.columns

    # convert index columns to start with 1
    id_cols = cols[cols.str.endswith('_id')]
    for col in id_cols:
        df[col] = df[col] + 1

    # save table to database
    df.to_sql(table_name, engine, index=False, if_exists='append')
Retrieving the Data
Before we dive into the interesting questions, the following are some basic characteristics of the dummy data:
- Date period: January 2015 to November 2015
- Total number of unique days in the
loanstable: 328 days - Total number of loans: 10,873 instances
- Total number of queues: 134 instances
- Total number of users: 300 users
- Total number of books: 300 books
- Total number of categories: 12 categories
- Total number of distinct authors: 179 authors
Next, we will examine some interesting questions from the dummy data.
1. What categories are borrowed the most?
Query:
select category_name, count(*) as loan_count
from loans
left join books using(book_id)
left join categories using(category_id)
group by category_name
order by loan_count desc
limit 5;
Output:
       category_name        | loan_count
----------------------------+------------
 Literature & Fiction       |       6772
 Teen & Young Adult         |       1387
 Biographies & Memoirs      |        925
 Religion & Spirituality    |        494
 Politics & Social Sciences |        362
From the above, we can see the top five categories that are borrowed the most, with “Literature & Fiction” as the top one which has been borrowed 6772 times.
2. Which authors are borrowed the most?
Query:
select author, count(*) as loan_count
from loans
left join books using(book_id)
group by author
order by loan_count desc
limit 5;
Output:
     author      | loan_count
-----------------+------------
 Sarah J. Maas   |        593
 Colleen Hoover  |        390
 J.K. Rowling    |        336
 Diana Gabaldon  |        284
 Suzanne Collins |        200
From the above, we can see the top five authors whose books are borrowed the most, starting from “Sarah J. Maas” which has been borrowed 593 times.
3. What’s the average, minimum, and maximum borrow duration (in days)?
Query:
select
    avg(loan_end::date - loan_start::date) as average_duration,
    min(loan_end::date - loan_start::date) as minimum_duration,
    max(loan_end::date - loan_start::date) as maximum_duration
from loans
where loan_end is not null;
Output:
  average_duration  | minimum_duration | maximum_duration
--------------------+------------------+------------------
 9.4659863945578231 |                1 |               14
As it turns out, the average duration for the borrowing is 9.47 days, and the maximum is 14 days as specified by the library requirement.
4. What book is borrowed the most in each month?
Query:
select date, title, count
from (
    select
        to_char(loan_start, 'yyyy-mm') as date,
        book_id,
        count(*) as count,
        rank() over(partition by to_char(loan_start, 'yyyy-mm')
                    order by count(*) desc,
                    book_id desc) as rank
    from loans
    group by date, book_id
)
left join books
    using(book_id)
where rank = 1;
Output:
  date   |                            title                            | count
---------+-------------------------------------------------------------+-------
 2015-01 | Fair Warning: The Instant Number One Bestselling Thriller   |    10
 2015-02 | A Little Life: A Novel                                      |     9
 2015-03 | Tower of Dawn (Throne of Glass Book 6)                      |    11
 2015-04 | The Hate U Give: A Printz Honor Winner                      |     9
 2015-05 | 1984                                                        |     9
 2015-06 | The 5 Love Languages: The Secret to Love that Lasts         |     8
 2015-07 | Sooley: A Novel                                             |     9
 2015-08 | The Beekeeper of Aleppo: A Novel                            |    10
 2015-09 | The Lincoln Highway: A Novel                                |    10
 2015-10 | Hillbilly Elegy: A Memoir of a Family and Culture in Crisis |     9
 2015-11 | Mad Honey: A Novel                                          |     7
From the above, we can see the most borrowed books in each month, along with how many times each book was borrowed (note: if there are two or more books with highest equal count in the same month, book with the lowest book_id will be chosen). As it turns out, each month has different most-popular book. We can also see that the maximum count in each month is only about 9-10 times.
5. Which categories are borrowed the most in each month?
Query:
select date, category_name, count
from (
    select
        to_char(loan_start, 'yyyy-mm') as date,
        category_id,
        count(*) as count,
        rank() over(partition by to_char(loan_start, 'yyyy-mm')
                    order by count(*) desc,
                    category_id desc) as rank
    from loans
    left join books
        using(book_id)
    group by date, category_id
)
left join categories
    using(category_id)
where rank = 1;
Output:
  date   |    category_name     | count
---------+----------------------+-------
 2015-01 | Literature & Fiction |   660
 2015-02 | Literature & Fiction |   599
 2015-03 | Literature & Fiction |   601
 2015-04 | Literature & Fiction |   573
 2015-05 | Literature & Fiction |   674
 2015-06 | Literature & Fiction |   604
 2015-07 | Literature & Fiction |   631
 2015-08 | Literature & Fiction |   644
 2015-09 | Literature & Fiction |   653
 2015-10 | Literature & Fiction |   658
 2015-11 | Literature & Fiction |   475
As it turns out, category “Literature & Fiction” was the most borrowed category in all of the months in the dataset, which was borrowed around 600 times each month. Why only one category? The reason is simple, if we do the following query:
select category_name, count(*) as count
from books
left join categories
    using(category_id)
group by category_name
order by count desc
limit 5;
We can see the following output:
       category_name        | count
----------------------------+-------
 Literature & Fiction       |   183
 Teen & Young Adult         |    38
 Biographies & Memoirs      |    27
 Religion & Spirituality    |    14
 Politics & Social Sciences |    11
The query above shows the top five categories with the most number of books, along with the count of books in each category. As you can see, the books in the dataset are concentrated on the “Literature & Fiction” category, which explains why that category became the most popular in each month.
Conclusion
In this report, I have outlined a database design and implementation for an e-library application. The design I have provided should solve most of the application’s requirements and needs. Moreover, the implementation for the database has also been demonstrated, along with the ERD, SQL syntax implementation, and a Python script to populate the database with dummy data. Lastly, I have also demonstrated some SQL queries that would be useful or interesting to answer.
References
- Amazon Kindle Books Dataset 2023: https://www.kaggle.com/datasets/asaniczka/amazon-kindle-books-dataset-2023-130k-books
- Repo for this project (detailed with steps to build the database): https://github.com/abangfarhan/simple-library-database
- Faker library documentation: https://faker.readthedocs.io