Introduction
Recently, I joined a small competition held by Pacmann (an online course provider for data science courses). In it, the participants were tasked to transform some data to a certain specification. My submission was chosen as one of the top 3, and this post will briefly explain how I solved the problem. You can go to the repo to see the full submission; it also contains the CSV files that needed to be transformed.
The Problem
I was tasked to transform the following data, which is based on a certain survey’s answers:
| Timestamp | Phone No. | Question 1 | Question 2 | … | Question 10 |
|---|---|---|---|---|---|
| #### | 08xx12 | B | B | … | A, B |
| #### | 08xx13 | D. Tidak memilih semua product | A | … | A, B |
| … | … | … | … | … | … |
As you can see, each respondent’s answer is stored as a single row, and each question’s answer is stored as a column. Each survey question has 4 choices: A, B, C, or D, where D means “none of the above”. Each question asked the respondent which of the three proposed courses they would prefer, and each course has the following details: skill, program type, and price. The respondent can choose more than 1 options (except if they chose “D”).
The task was to convert the above data into the following format:
| user_phone | choice | skill | bentuk_program | harga_program |
|---|---|---|---|---|
| 08xx12 | 1 | Create Analytics Dashboard | Tutorial Based | Rp 500.000,0 |
| 08xx12 | 0 | Perform Customer Segmentation | Mentoring Based | Rp 350.000,0 |
| 08xx12 | 0 | Design AB Test Experimentation | Mentoring Based | Rp 300.000,0 |
| … | … | … | … | … |
We need to convert each question’s answer from each user into 3 rows, where each row corresponds to each question’s choice. Column choice is 1 if the user chose the program, and 0 otherwise. Meanwhile, the skill, bentuk_program, and harga_program columns are based on the course specification. Since each user answers 10 questions, and there are 3 course options in each question, then in the end there would be N × 10 x 3 rows, where N is the number of (valid) respondents.
My Solution
As instructed, I used Python programming language + Pandas module to tackle this problem. My solution involves pretty intermediate techniques, including melt-ing data (converting from “wide” to “long” data format), and concatenating multiple data together.
Inputting course specifications
The first big problem I needed to take care of was the program detail specifications, since the provided data didn’t contain this information. So, I headed to the survey page, and lo and behold, the course specifications for each question was in image format:
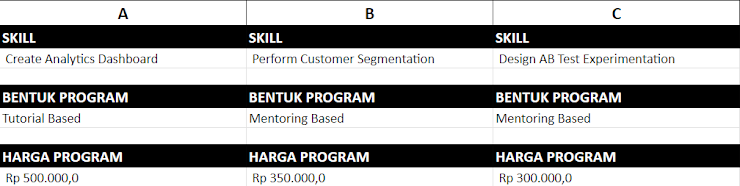
It means that I cannot copy-pasted the texts. What a major hassle. So, did I type them manually? I figured out that it’d actually be faster to download all 10 images and run Tesseract OCR program, and tidy up the generated text by hand. And so that’s what I did. By the way, below is a little PowerShell script I wrote to do the job:
gci images\*.png | % {
    echo $_.Name
    tesseract.exe --psm 6 $_ stdout
    echo "-------"
} | sc ocr_output.txt
Executing the above PowerShell script would execute Tesseract for each png file in the “images” folder, and put all of the output into the ocr_output.txt file. After that, I modified the text file to be in a specific format, so I can parse it with Python later. I also renamed the text file to programs_specifications.txt. Below is an example of the text file:
01
Create Analytics Dashboard,Perform Customer Segmentation,Design AB Test Experimentation
Tutorial Based,Mentoring Based,Mentoring Based
500_000,350_000,300_000
---
02
Create Analytics Dashboard,Design Data Pipeline,Perform Credit Scoring Analytics
Tutorial Based,Mentoring Based,Mentoring Based
500_000,300_000,550_000
The text contains 10 “blocks” that are separated by three dashes, where each block corresponds to a question. There are four lines in each block:
- Question number
- List of skills (comma-separated)
- List of bentuk program (comma-separated)
- List of prices (comma-separated)
I chose to use this format (instead of, say, CSV or YAML) because I wanted to be able to read them easily with my eyes, and so that I can check with the original images that the data are 100% correct. However, the downside is that I have to write my own parser for this file format.
Data wrangling
Now that that’s taken care of, we can begin the actual data wrangling. I figured out that the process can be broken down into five steps, which will be explained below.
Before we begin, let’s import the only module we need:
import pandas as pd
Step 1: load and prepare the data. There are actually two data sources for this challenge. Luckily, both data are already in the exact same format, and both data contain no duplicates whatsoever; therefore, we can simply concatenate them together:
df_org = pd.read_csv('./conjoint_survey_organic.xlsx - Sheet1.csv')
df_ads = pd.read_csv('./conjoint_survey_ads.csv')
df = pd.concat([df_org, df_ads]).reset_index(drop=True).drop('Timestamp', axis=1)
I also removed the Timestamp column, since it’s not needed in our case here.
At this point, there are 11 columns in the dataframe. The first column contains the respondent’s phone number, while the rest of the 10 columns contain each question’s answers. For those 10 columns, the column headers contain the full question text; for example, one of the column is named "1. Produk manakah yang akan beli? ...". I wanted to simplify this by only retaining the number part:
qcol_start = 1 # index where the question column starts
question_cols = [int(col.split('.')[0]) for col in df.columns[qcol_start:]]
df.columns = ['user_phone', *question_cols]
Lastly, I also wanted to clean the question columns. For example, given the following column:
| 2 |
|---|
| A |
| C, D. Tidak memilih semua product |
| D. Tidak memilih semua product |
| D. Tidak memilih semua product |
| D. Tidak memilih semua product |
… I wanted to convert it to:
| 2 |
|---|
| [‘A’] |
| [‘C’,’D’] |
| [‘D’] |
| [‘D’] |
| [‘D’] |
That is, I want to (1) remove unnecessary texts and whitespaces and (2) convert the string into list of strings. To do that, first I created the following method, which is applicable to a single Pandas series (dataframe column):
def clean_question_column(col: pd.Series) -> pd.Series:
    '''
    Convert question column from consisting of strings to list of strings.
    For example, input column values: ["A,B", "B", "C"]
    Output: [["A","B"], ["B"], ["C"]]
    '''
    col = col.str.replace('. Tidak memilih semua product', '', regex=False)
    col = col.str.replace(' ', '')
    col = col.str.split(',')
    return col
Then, I apply the function above to each column in df starting from the second column:
df.iloc[:,qcol_start:] = df.iloc[:,qcol_start:].apply(clean_question_column)
The variable df now looks like the following:
| user_phone | 1 | … | 10 |
|---|---|---|---|
| 08xx336019xxx | [‘B’] | … | [‘A’] |
| 08xx10001xxx | [‘C’] | … | [‘A’] |
| 08xx56592xxx | [‘D’] | … | [‘A’] |
| 08xx391631xxx | [‘D’] | … | [‘A’] |
| 08xx21820xxx | [‘D’] | … | [‘D’] |
| … | … | … | … |
Step 2: remove invalid rows. We need to discard user data that chose both D (“none of the above”) and any other options A-C, on any question. This is per the instruction, and is a valid thing to do since the answer was contradictive. I did this with the following method:
is_invalid = lambda lst: 'D' in lst and len(lst) > 1
invalid_rows = df.iloc[:,qcol_start:].apply(lambda col: col.apply(is_invalid)).any(axis=1)
df = df[~invalid_rows]
This part is a little tricky, so let’s unpack them one by one.
The is_invalid variable is a lambda/anonymous function that, given a list of string, will return True if the letter 'D' is in that list and that list’s length is greater than 1. A True in this case means the answer is not valid, since the respondent chose both “D” and any other option. For example, is_invalid(['A', 'B']) will return False, while is_invalid(['A',' D']) will return True.
df.iloc[:,qcol_start:].apply(lambda col: col.apply(is_invalid)) will simply check each cell in the question columns if they’re invalid or not. Here’s an example output:
| 1 | … | 10 |
|---|---|---|
| False | … | False |
| False | … | True |
| False | … | False |
| False | … | False |
| … | … | … |
A True indicates that the cell in that position is not valid. Finally, we check for each row if there’s any invalid cell by adding .any(axis=1) to the end of the operation. Thus, the variable invalid_rows is a Pandas series containing boolean values, where invalid rows are indicated by True. We then filter df with the usual method: df[~invalid_rows] (the ~ symbol will invert/negate the boolean values, so we keep rows that are not invalid).
At this point, the dataframe still in the same format as in the last of Step 1, except now that invalid rows have been filtered out.
Step 3: melt the data. We convert the previous dataframe such that each user and each question is stored in separate rows. I’d like to call this operation “wide to long transformation”, which I originally learned while learning the R programming language. In R with the tidyverse packages, the function is called gather, and the opposite (“long to wide transformation”) is called spread. Meanwhile, in Pandas the “wide to long transformation” is called melt and the opposite is pivot.
Anyway, this is how I pivot the dataframe:
df2 = df.melt(id_vars='user_phone', var_name='Question', value_name='Choices')
Output:
| user_phone | Question | Choices |
|---|---|---|
| 08xx336019xxx | 1 | [‘B’] |
| 08xx56592xxx | 1 | [‘D’] |
| 08xx391631xxx | 1 | [‘D’] |
| 08xx21820xxx | 1 | [‘D’] |
| … | … | … |
Now, there are 10 rows for each user. For example, if I run this:
df2[df2['user_phone']=='08xx336019xxx']
The output would be:
| user_phone | Question | Choices |
|---|---|---|
| 08xx336019xxx | 1 | [B] |
| 08xx336019xxx | 2 | [A] |
| 08xx336019xxx | 3 | [A] |
| 08xx336019xxx | 4 | [A] |
| 08xx336019xxx | 5 | [A] |
| 08xx336019xxx | 6 | [B] |
| 08xx336019xxx | 7 | [A] |
| 08xx336019xxx | 8 | [C] |
| 08xx336019xxx | 9 | [A] |
| 08xx336019xxx | 10 | [A] |
To prepare for the next step, I will create three new columns: “A”, “B”, and “C”. These columns will contain boolean values, indicating if the respondent chose the option as stated in the column name. We do it with the following method:
letters = ('A', 'B', 'C')
for letter in letters:
    df2[letter] = df2['Choices'].apply(lambda choices: letter in choices)
The output is:
| user_phone | Question | Choices | A | B | C |
|---|---|---|---|---|---|
| 08xx336019xxx | 1 | [‘B’] | False | True | False |
| 08xx56592xxx | 1 | [‘D’] | False | False | False |
| 08xx391631xxx | 1 | [‘D’] | False | False | False |
| 08xx21820xxx | 1 | [‘D’] | False | False | False |
| … | … | … | … | … | … |
Step 4: melt the data again. At this stage, we want each option (A, B, C) to have its own rows. We simply do this with another melt operation:
df3 = (df2.drop('Choices', axis=1)
       .melt(id_vars=['user_phone', 'Question'], var_name='Option', value_name='Chosen?')
       .sort_values(['user_phone', 'Question', 'Option'])
       .reset_index(drop=True))
Output:
| user_phone | Question | Option | Chosen? |
|---|---|---|---|
| 05xx61268xxx | 1 | A | True |
| 05xx61268xxx | 1 | B | False |
| 05xx61268xxx | 1 | C | False |
| 05xx61268xxx | 2 | A | False |
| 05xx61268xxx | 2 | B | True |
| … | … | … | … |
The last code block might look a little bit too complicated, but generally I prefer to use method chaining while transforming data. I learned this style while learning R (in R, method chaining is usually done with the pipe operator %>%). I like this style because I prefer not to re-assign existing variables too much, or create too much intermediate variables (because naming things are difficult).
Let’s unpack the operation one by one:
df2.drop('Choices', axis=1)will drop columnChoices(since we don’t need it anymore)..melt(id_vars=['user_phone', 'Question'], var_name='Option', value_name='Chosen?')will convert each columns A, B, and C into its own rows. The name of the columns after this operation would be['user_phone', 'Question', 'Option', and 'Chosen?']. TheOptioncolumn is the letter of each question’s option, whileChosen?will indicates if the respondent chose that option..sort_values(['user_phone', 'Question', 'Option'])will sort the dataframe in alphabetical order, according to the specified columns; it means that the dataframe will be sorted first by theuser_namecolumn, then theQuestioncolumn, and finally by theOptioncolumn. This part is important for Step 5..reset_index(drop=True)will reset the index.
After that, we create a new column choice, by simply converting the boolean values in Chosen? column into integer (1 if True, 0 if False):
df3['choice'] = df3['Chosen?'].astype(int)
Output:
| user_phone | Question | Option | Chosen? | choice |
|---|---|---|---|---|
| 05xx61268xxx | 1 | A | True | 1 |
| 05xx61268xxx | 1 | B | False | 0 |
| 05xx61268xxx | 1 | C | False | 0 |
| 05xx61268xxx | 2 | A | False | 0 |
| 05xx61268xxx | 2 | B | True | 1 |
| … | … | … | … | … |
Now we are very close to the desired outcome. But first let’s make sure the data shape is correct:
# Make sure df3 is in the correct size
n_users = len(df['user_phone'].unique())
n_choices = len(letters)
n_questions = len(question_cols)
assert len(df3) == n_users * n_choices * n_questions
[]()
Like I stated in the beginning, in the end there would be N × 10 x 3 rows; in this case, n_users is N, n_choices is 3, and n_questions is 10.
Step 5: concatenate the course specifications. Now we only need to put in the course specifications for each option. To do that, we must first parse the programs_specifications.txt file. I created the following function to do that:
def load_questions():
    '''
    Here we load the programs_specifications.txt file, which contain program
    details for each survey question. The text file has a specific format, where
    each block/question is separated by three dashes ("---"), and there are 4 lines
    in each block:

    1. Question number
    2. List of skills (comma-separated)
    3. List of bentuk program (comma-separated)
    4. List of prices (comma-separated)

    FYI, the txt file was typed in manually based on the survey page on
    https://forms.gle/B5fW1Mxk2Pc3EShf6
    '''
    with open('programs_specifications.txt', 'r') as f:
        text = f.read()

    programs = []
    for block in text.strip().split('---'):
        lines = block.strip().split('\n')
        number = int(lines[0])
        program_skills = lines[1].split(',')
        program_types = lines[2].split(',')
        program_prices = lines[3].split(',')
        program = []
        for pskill,ptype,pprice in zip(program_skills, program_types, program_prices):
            price = f"Rp {pprice.replace('_', '.')},0"
            program.append({'no': number, 'skill': pskill, 'bentuk_program': ptype, 'harga_program': price})
        programs.append(program)
    return programs
We load the course specifications:
questions = load_questions()
assert len(questions) == n_questions
For example, questions[0] returns the following:
[
  {"no": 1, "skill": "Create Analytics Dashboard", "bentuk_program": "Tutorial Based", "harga_program": "Rp 500.000,0"},
  {"no": 1, "skill": "Perform Customer Segmentation", "bentuk_program": "Mentoring Based", "harga_program": "Rp 350.000,0"},
  {"no": 1, "skill": "Design AB Test Experimentation", "bentuk_program": "Mentoring Based", "harga_program": "Rp 300.000,0"}
]
That is, each item in questions is a list with length equals to 3, where each item corresponds to a course option.
We then convert all of the course specifications into a dataframe.
questions_flat = [val for sublist in questions for val in sublist] # flatten list
dfq = pd.DataFrame(questions_flat)
dfq['Option'] = ['A', 'B', 'C'] * len(questions)
Below is the first 6 rows of dfq:
| no | skill | bentuk_program | harga_program | Option |
|---|---|---|---|---|
| 1 | Create Analytics Dashboard | Tutorial Based | Rp 500.000,0 | A |
| 1 | Perform Customer Segmentation | Mentoring Based | Rp 350.000,0 | B |
| 1 | Design AB Test Experimentation | Mentoring Based | Rp 300.000,0 | C |
| 2 | Create Analytics Dashboard | Tutorial Based | Rp 500.000,0 | A |
| 2 | Design Data Pipeline | Mentoring Based | Rp 300.000,0 | B |
| 2 | Perform Credit Scoring Analytics | Mentoring Based | Rp 550.000,0 | C |
| … | … | … | … | … |
Since dfq is ordered in the same way as df3 (by ['Question', 'Option'] columns), then we can just repeat dfq by n_users times and concatenate the resulting data with df3:
dfq2 = pd.concat([dfq] * n_users).reset_index(drop=True)
df4 = pd.concat([df3, dfq2], axis=1)
Finally, we select only the columns that we need, and save the data into a file:
output = df4[['user_phone', 'choice', 'skill', 'bentuk_program', 'harga_program']]
output.to_csv('clean_data.csv', index=False)
Conclusion
That’s it! I hope you learn something by reading this post. Have a nice day!